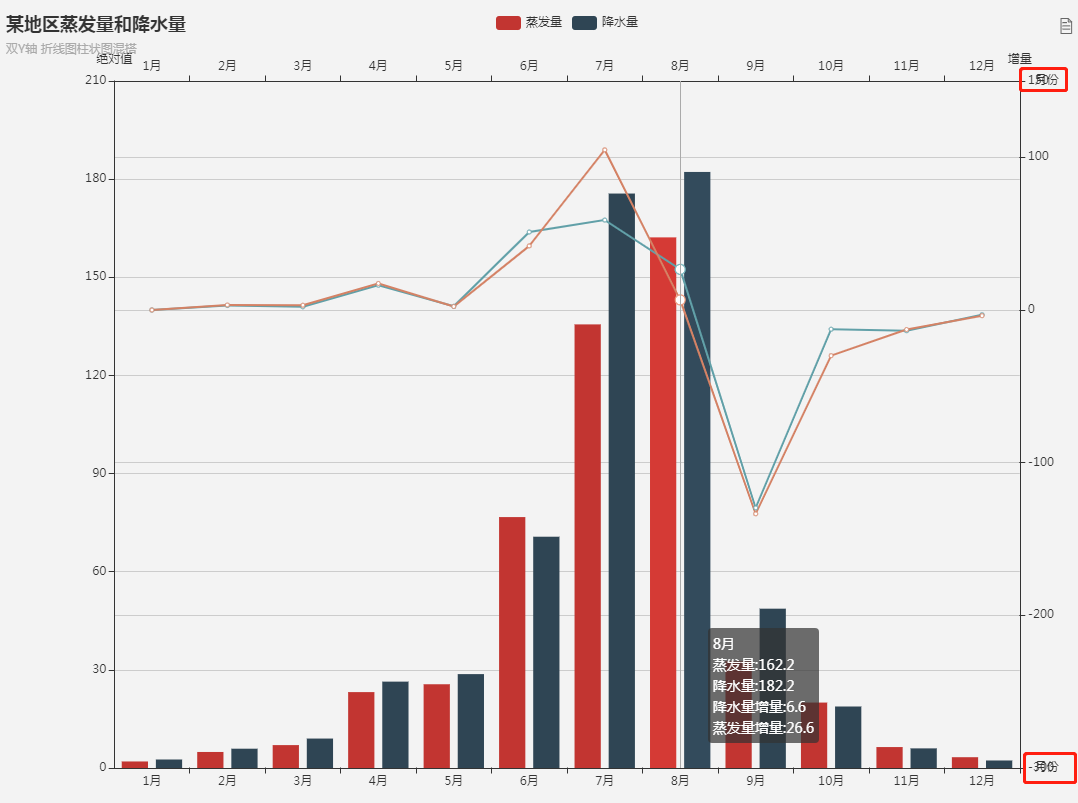
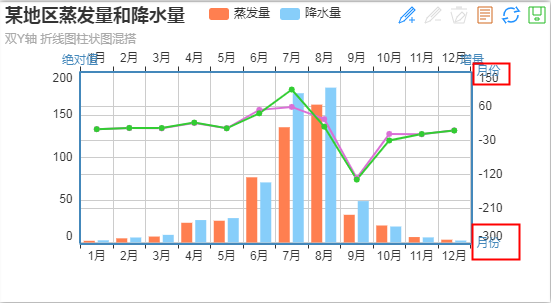
effect
Echarts
option Code
option={
    title: {
        text: "",
        subtext: "Y "
    },
    legend: {
        data: ["", ""]
    },
    xAxis: [
        {
            type: "category",
            axisLine: {
                onZero: false
            },
            data: ["1", "2", "3", "4", "5", "6", "7", "8", "9", "10", "11", "12"],
            name: ""
        },
        {
            type: "category",
            axisLine: {
                onZero: false
            },
            data: ["1", "2", "3", "4", "5", "6", "7", "8", "9", "10", "11", "12"],
            name: ""
        }
    ],
    grid: {
        y: 70
    },
    yAxis: [
        {
            type: "value",
            name: ""
        },
        {
            type: "value",
            name: "",
            min: -300,
            max: 150
        }
    ],
    series: [
        {
            name: "",
            type: "bar",
            data: [2, 4.9, 7, 23.2, 25.6, 76.7, 135.6, 162.2, 32.6, 20, 6.4, 3.3]
        },
        {
            name: "",
            type: "bar",
            data: [2.6, 5.9, 9, 26.4, 28.7, 70.7, 175.6, 182.2, 48.7, 18.8, 6, 2.3]
        },
        {
            name: "",
            type: "line",
            yAxisIndex: 1,
            data: [0, 2.9, 2.1, 16.2, 2.4, 51.1, 58.9, 26.6, -129.6, -12.6, -13.6, -3.1],
            xAxisIndex: 1
        },
        {
            name: "",
            type: "line",
            yAxisIndex: 1,
            data: [0, 3.3, 3.1, 17.4, 2.3, 42, 104.9, 6.6, -133.5, -29.9, -12.8, -3.7]
        }
    ]
}
