from sklearn.datasets import load_iris
import matplotlib.pyplot as plt

iris = load_iris()
s = iris.data[iris.target == 1, 3]
plt.hist(s)
plt.show()
s is of ndarray type. The specific data are as follows:
[1.4 1.5 1.5 1.3 1.5 1.3 1.6 1. 1.3 1.4 1. 1.5 1. 1.4 1.3 1.4 1.5 1.5.
1.5 1.1 1.8 1.3 1.5 1.2 1.2 1.4 1.4 1.47 1.1.1.1 1.26 1.5 1.6
1.51.3 1.3 1.31 .3 1.2 1.4 1.2 1. 1.3 1.2 1.3 1.3 1.1 1.3]
1. There were 7 times, 1.1 3 times, 1.2 5 times, 1.3 13 times, 1.4 5 times, 1.5 10 times, 1.6 3 times, 1.7 and 1.8 each.
the figure drawn is as follows:
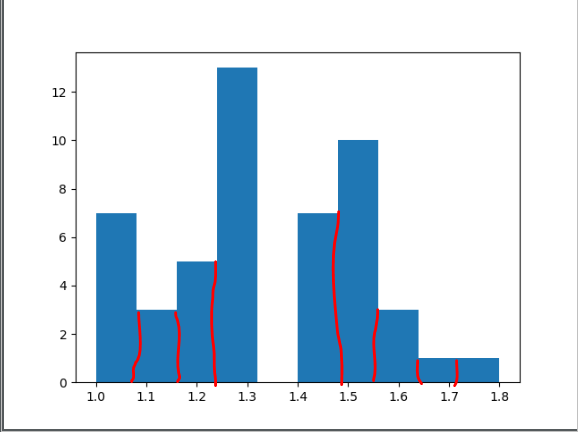
Why is it not aligned with the scale? And why is there a gap between 1.3 and 1.4?