Phpstorm breakpoint debugging

php has installed the xdebug module. The php.ini configuration is as follows:
[XDebug]
xdebug.profiler_output_dir= "D:phpStudytmpxdebug"
xdebug.trace_output_dir= "D:phpStudytmpxdebug"
xdebug.profiler_enable = 1
xdebug.auto_trace=on
xdebug.collect_params=on
zend_extension= "D:phpStudyphpphp-5.6.27-ntsextphp_xdebug.dll"
xdebug.idekey = PHPSTORM
xdebug.remote_port=9000
xdebug.remote_handler=dbgp
xdebug.remote_host = "127.0.0.1"
; xdebug.var_display_max_children=256
; xdebug.var_display_max_data=512
Xdebug.var_display_max_depth=5
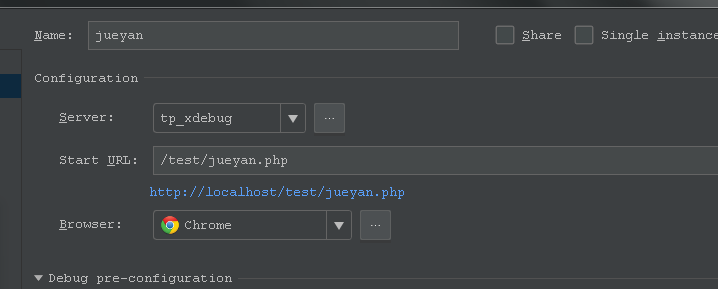
phpstorm

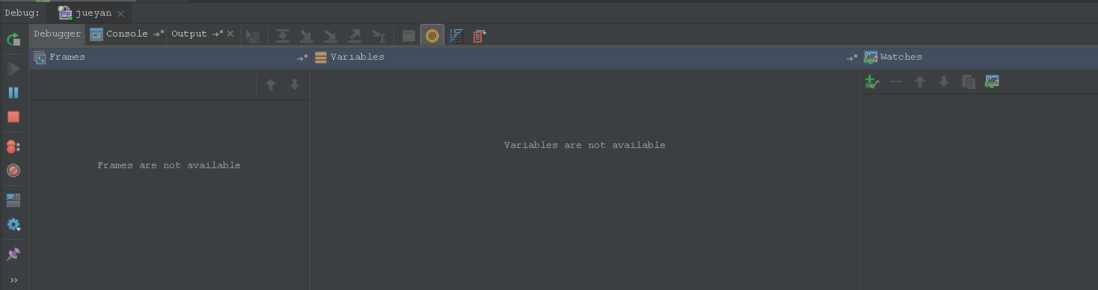
there is nothing on the display at the breakpoint. Can you give me some advice?

Jun.07,2022

if no parameters are passed, it is recommended that you install a chrome debug extension https://chrome.google.com/web...


solution: https://gist.github.com/c9570...
follow this process. Normally, breakpoints can be broken anywhere and no plug-ins need to be installed.


2019-02-02 08:54 occupy a pit first. Now go and write an article. It certainly won't work if you configure it like this. Many of them are not configured to
2019-02-02 10:13. I finished writing how to configure (address inside the codeshelper site) PhpStorm configuration Xdebug debugging The breakpoint logic of


php generally requires the page to pass a parameter and a browser plug-in needs to be installed. Activate the browser plug-in, and then manipulate the page. If the breakpoint process listens with this parameter, you can run to the breakpoint debugging.

Menu