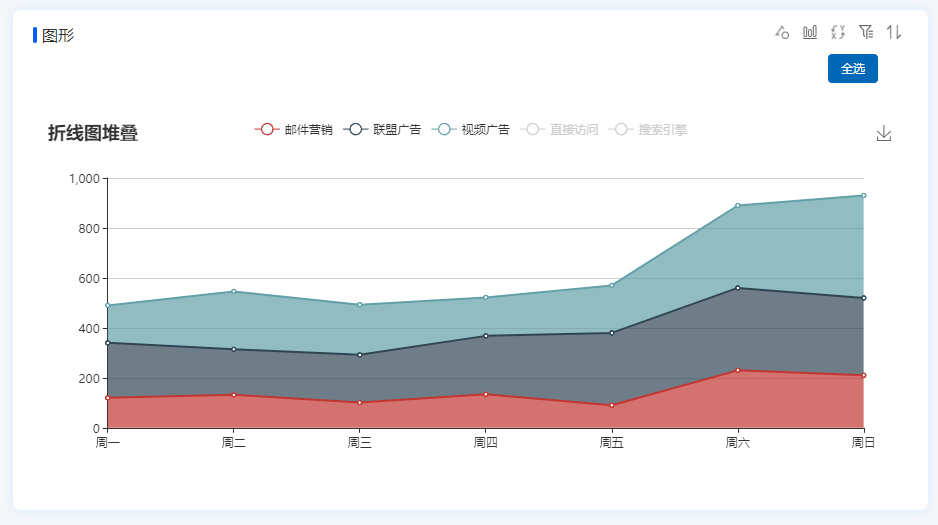
1. A requirement appears in the project (see the matching figure), which initially displays 3 important data. Because there are many data classes (not a lot of data is shown in the figure, just an example), users report that if they want to see all the points, they want a control such as select all.
reference article: https://www.cnblogs.com/isuif...
Thearticle has implemented the all and deselect functions (I slightly modified the trigger logic), and now I just want to improve it. Trigger "deselect all" to revert to the initial value (showing 3 important data), rather than showing no data at all.
idea:
1. There is a selected attribute in the echarts document. False represents no initial display, and the default selected does not write anything is a full display.
selected: {
      "": false,
      "": false,
    },
code (below), the display attribute is obtained through obj [selectAllkey] = val. Now select all all = true, and vice versa is all = false, how to separate 3 pieces of data to do true when all = false.
html button:
<input id="selectall" type="button" class="btn btn-primary" value="" />
js:
<script type="text/javascript">
// domecharts
var myChart = echarts.init(document.getElementById("main"));
//
option = {
  title: {
    text: ""
  },
  tooltip: {
    trigger: "axis"
  },
  legend: {
    data: ["", "", "", "", ""],
    selected: {
      "": false,
      "": false,
    },
    // selectedMode: "single",
    // selectedMode: "multiple",
  },
  grid: {
    left: "3%",
    right: "4%",
    bottom: "3%",
    containLabel: true
  },
  toolbox: {
    feature: {
      saveAsImage: {}
    }
  },
  xAxis: {
    type: "category",
    boundaryGap: false,
    data: ["", "", "", "", "", "", ""]
  },
  yAxis: {
    type: "value"
  },
  series: [
    {
      name: "",
      type: "line",
      stack: "",
      areaStyle: {},
      data: [120, 132, 101, 134, 90, 230, 210],
    },
    {
      name: "",
      type: "line",
      stack: "",
      areaStyle: {},
      data: [220, 182, 191, 234, 290, 330, 310]
    },
    {
      name: "",
      type: "line",
      stack: "",
      areaStyle: {},
      data: [150, 232, 201, 154, 190, 330, 410]
    },
    {
      name: "",
      type: "line",
      stack: "",
      areaStyle: {},
      data: [320, 332, 301, 334, 390, 330, 320]
    },
    {
      name: "",
      type: "line",
      stack: "",
      areaStyle: {},
      data: [820, 932, 901, 934, 1290, 1330, 1320]
    }
  ]
};

//
myChart.setOption(option);
var selectAll = myChart.getOption().legend[0].data;

$("-sharpselectall").click(function () {
  var flag = $(this).attr("flag");
  if (flag == 0) {
    var val = false;
    $(this).attr("flag", 1);
    $(this).val("");
  } else {
    var val = true;
    $(this).attr("flag", 0);
    $(this).val("");
  }
  var obj = {};
  for (var key in selectAll) {
    obj[selectAll[key]] = val;
  }
  option.legend.selected = obj;
  myChart.setOption(option);
});
</script>