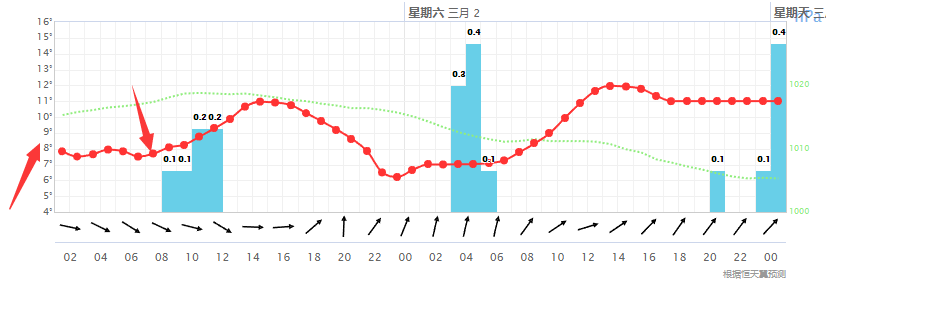
table are as follows
chart: {
            renderTo: this.container,
            marginBottom: 70,
            marginRight: 40,
            marginTop: 50,
            plotBorderWidth: 1,
            width: 800,
            height: 310
        },
        title: {
            text: this.getTitle(),
            align: "left"
        },
        credits: {
            text: "<a href="https://yr.no"></a>",
            href: this.xml.credit.link["@attributes"].url,
            position: {
                x: -40
            }
        },
        tooltip: {
            shared: true,
            useHTML: true,
            formatter: function () {
                return meteogram.tooltipFormatter(this);
            }
        },
        xAxis: [{ //  X axis
            type: "datetime",
            tickInterval: 2 * 36e5, // two hours
            minorTickInterval: 36e5, // one hour
            tickLength: 0,
            gridLineWidth: 1,
            gridLineColor: (Highcharts.theme && Highcharts.theme.background2) || "-sharpF0F0F0",
            startOnTick: false,
            endOnTick: false,
            minPadding: 0,
            maxPadding: 0,
            offset: 30,
            showLastLabel: true,
            labels: {
                format: "{value:%H}"
            }
        }, { // Top X axis
            linkedTo: 0,
            type: "datetime",
            tickInterval: 24 * 3600 * 1000,
            labels: {
                format: "{value:<span style="font-size: 12px; font-weight: bold">%a</span> %b %e}",
                align: "left",
                x: 3,
                y: -5
            },
            opposite: true,
            tickLength: 20,
            gridLineWidth: 1
        }],
        yAxis: [{ //  axis
            title: {
                text: null
            },
            labels: {
                format: "{value}",
                style: {
                    fontSize: "10px"
                },
                x: -3
            },
            plotLines: [{ // zero plane
                value: 0,
                color: "-sharpBBBBBB",
                width: 1,
                zIndex: 2
            }],
            //
            tickPositioner: function () {
                var max = Math.ceil(this.max) + 1,
                    pos = max - 12, // start
                    ret;
                if (pos < this.min) {
                    ret = [];
                    while (pos <= max) {
                        ret.push(pos += 1);
                    }
                }
                return ret;
            },
            maxPadding: 0.3,
            tickInterval: 1,
            gridLineColor: (Highcharts.theme && Highcharts.theme.background2) || "-sharpF0F0F0"
        }, { // precipitation axis
            title: {
                text: null
            },
            labels: {
                enabled: false
            },
            gridLineWidth: 0,
            tickLength: 0
        }, { //
            allowDecimals: false,
            title: { // Title on top of axis
                text: "hPa",
                offset: 0,
                align: "high",
                rotation: 0,
                style: {
                    fontSize: "16px",
                    color: Highcharts.getOptions().colors[0]
                },
                textAlign: "left",
                x: 3
            },
            labels: {
                style: {
                    fontSize: "8px",
                    color: Highcharts.getOptions().colors[2]
                },
                y: 2,
                x: 3
            },
            gridLineWidth: 0,
            opposite: true,
            showLastLabel: false
        }],
        legend: {
            enabled: false
        },
        plotOptions: {
            series: {
                pointPlacement: "between"
            }
        },
        series: [{
            name: "",
            data: this.temperatures,
            type: "spline",
            marker: {
                enabled: true,
                states: {
                    hover: {
                        enabled: true
                    }
                }
            },
            tooltip: {
                valueSuffix: "C"
            },
            zIndex: 1,
            color: "-sharpFF3333",
            negativeColor: "-sharp48AFE8"
        },
         {
            name: "",
            data: this.precipitations,
            type: "column",
            color: "-sharp68CFE8",
            yAxis: 1,
            groupPadding: 0,
            pointPadding: 0,
            borderWidth: 0,
            shadow: false,
            dataLabels: {
                enabled: true,
                formatter: function () {
                    if (this.y > 0) {
                        return this.y;
                    }
                },
                style: {
                    fontSize: "8px"
                }
            },
            tooltip: {
                valueSuffix: "mm"
            }
        }, {
            name: "",
            color: Highcharts.getOptions().colors[2],
            data: this.pressures,
            marker: {
                enabled: false
            },
            shadow: false,
            tooltip: {
                valueSuffix: " hPa"
            },
            dashStyle: "shortdot",
            yAxis: 2
        },
      ]
} 
the above parameter configuration implements the table as shown in the figure
now I want to change the data source corresponding to the red curve to the data source of wind speed. How should I change it? if you only change data, there will be garbled rookies asking for advice
.